The main key objective is to handle information correctly. Technical drawing is developed as a tool to represent information (surveyed or design) and not just geometric information. The goal is to describe in a clear, simple, and straightforward manner the information appropriate to the purpose of the individual representation, so that the data will be interpreted correctly and uniquely by any recipient.
Architectural and engineering drawings are information created and interpreted by a coded language. It is necessary to know the language and its code to be able to interpret the information correctly. This language is highly symbolic and has several dialects: Architecture | Mechanics | Plants | Products
By describing 3D shapes using 2D drawings, “impossible” shapes can be drawn. Examples are Penrose's triangle; Ytturalde's shapes; and many of Escher's drawings.

Describing physically already real objects can be very different from design drawing. When returning a survey, it is necessary to choose the type of information to describe while inevitably discarding others (e.g., rectifying course and edges of walls by discarding the actual slightest irregularities); moreover, it is impossible to know the object completely so it is necessary to adopt increasingly in-depth levels of detail based on the available information (e.g., the interior of walls).
When representing designs, one has all the information available and the shapes and details are ideally perfect.In this approach, it is very important to select the level of information development and not to add inappropriate data at the design stage with respect to the purpose of the design.
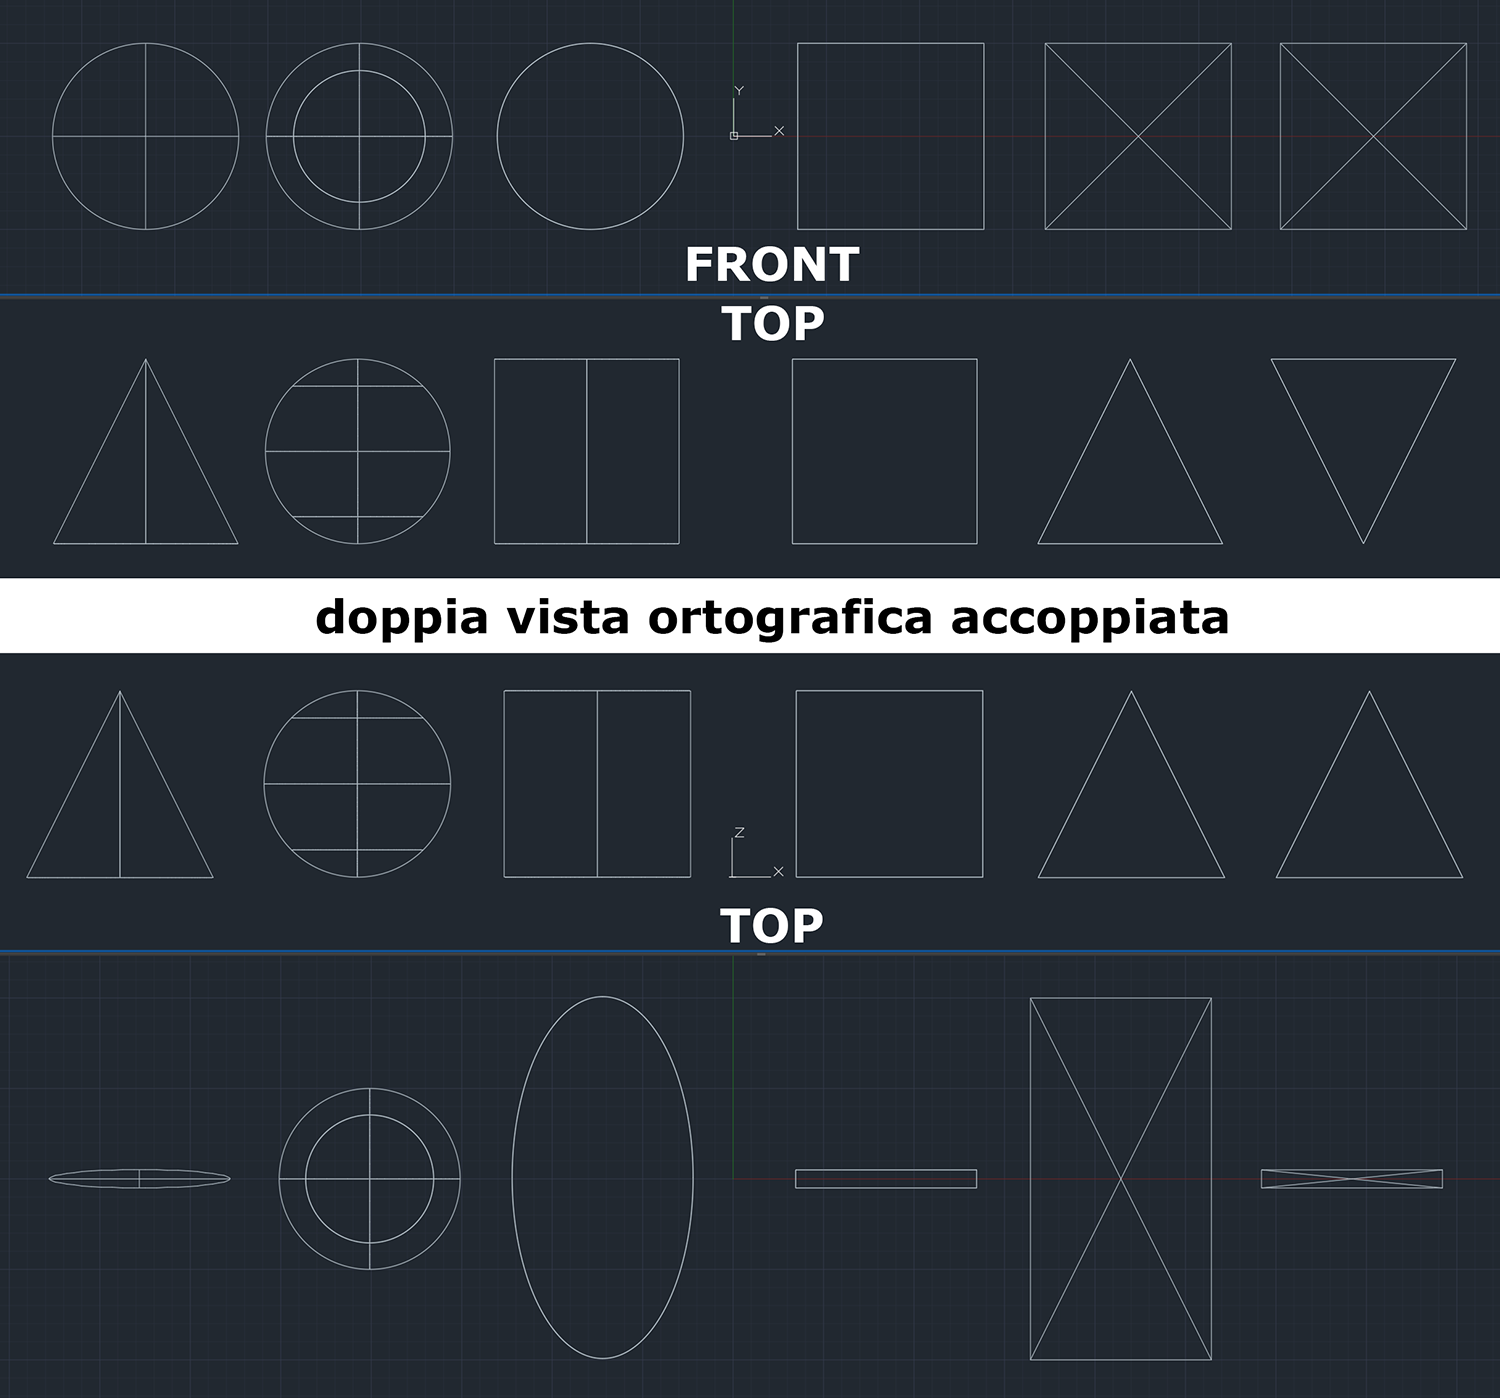
The overall problem is working in a 3-dimensional space using visualization (monitor) and data input (mouse) tools in only 2 dimensions. Perspective is an intuitive visualization system that “simulates” the third dimension but does so by fooling the viewer. Orthogonal projections, on the other hand, are really 2-dimensional so they are perfectly coherent with the monitor/mouse system, but they do not allow the description of depth.
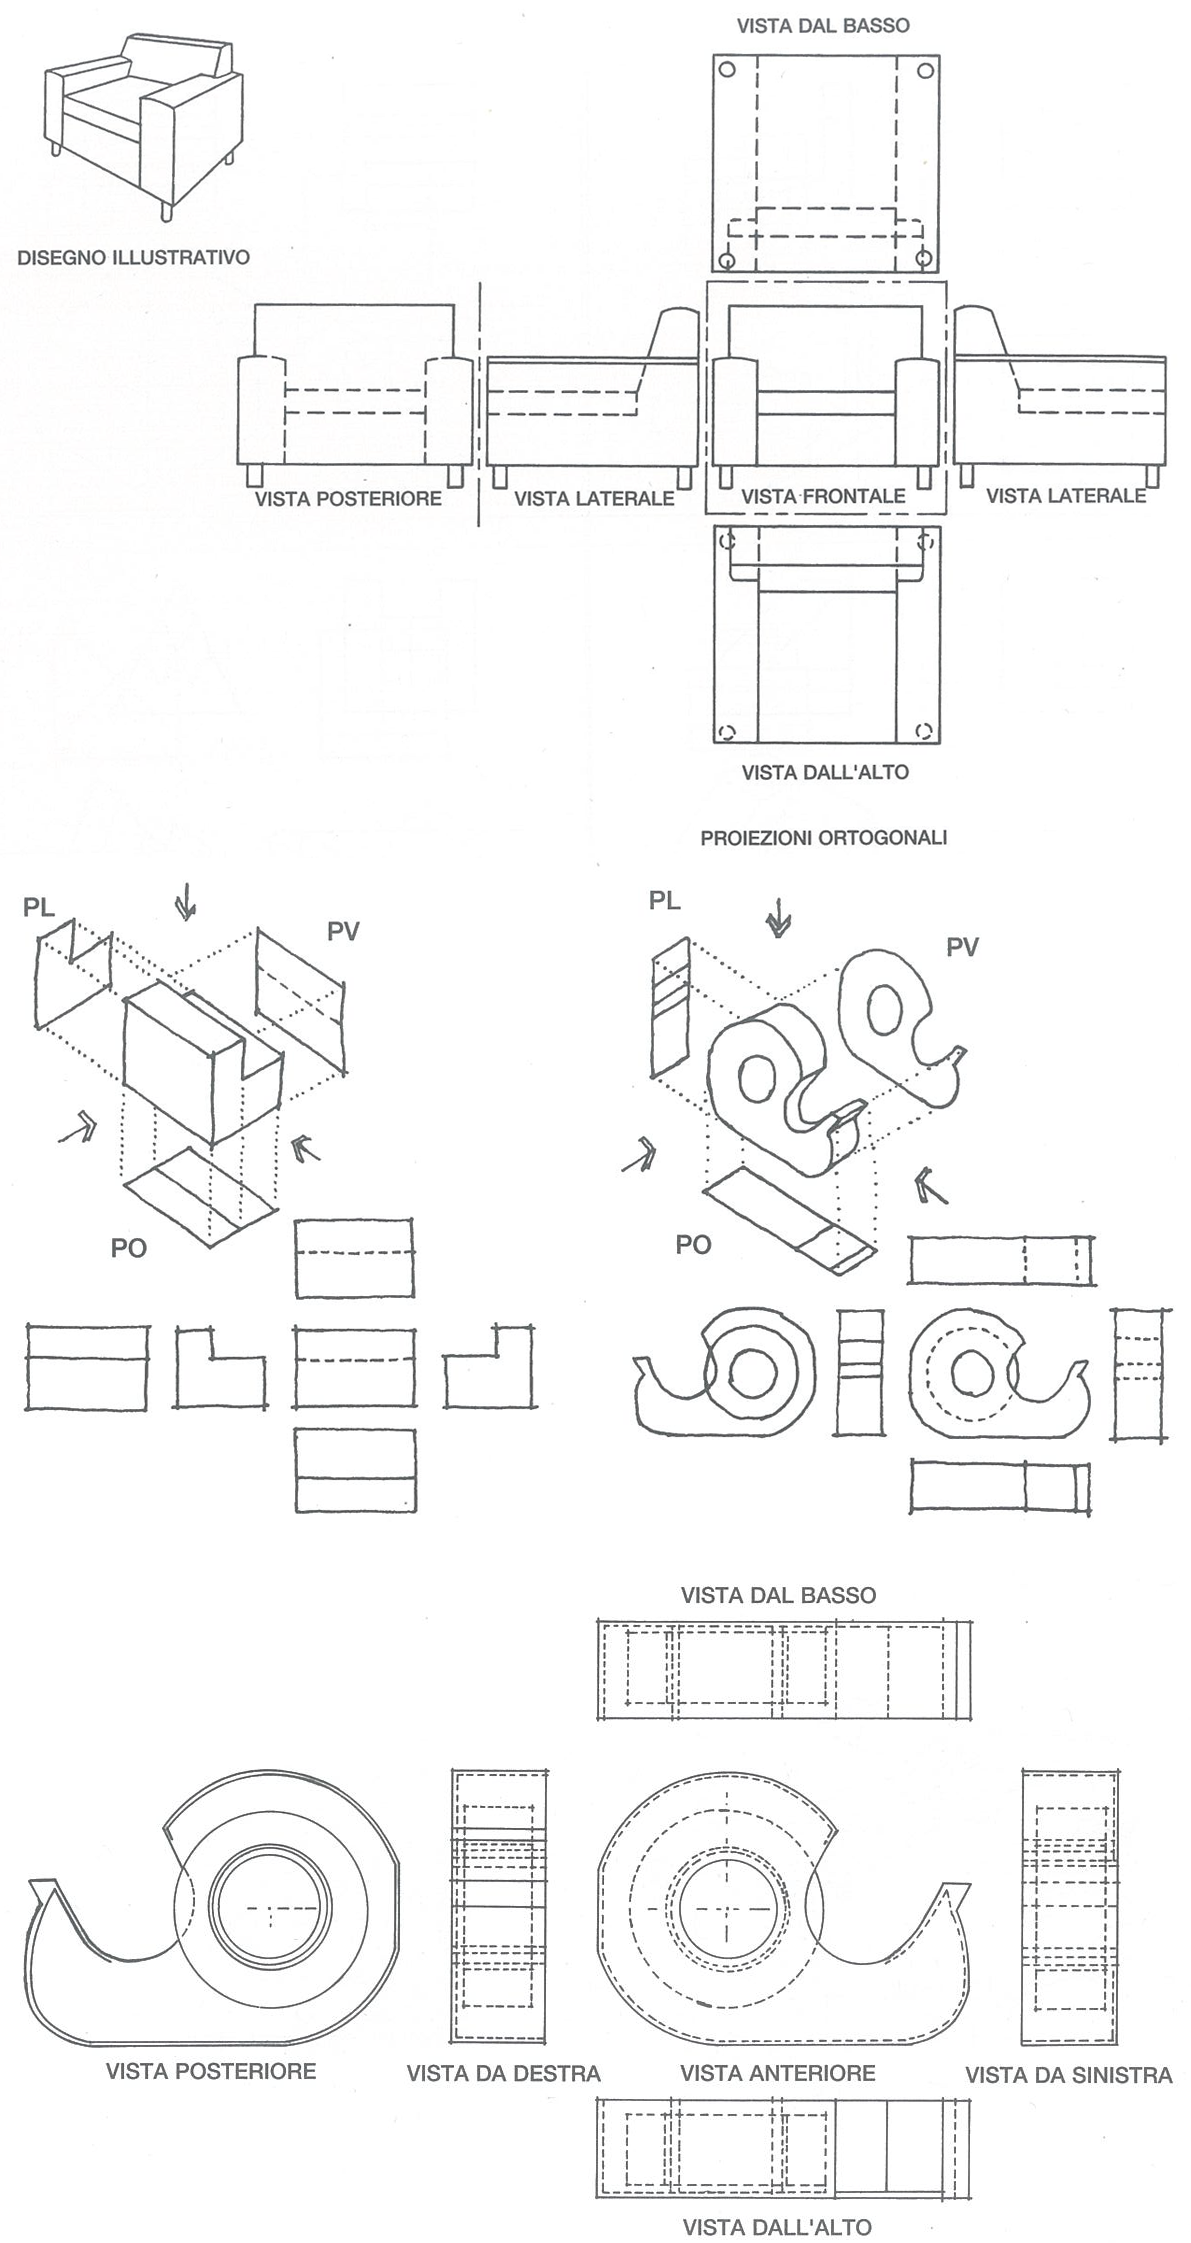
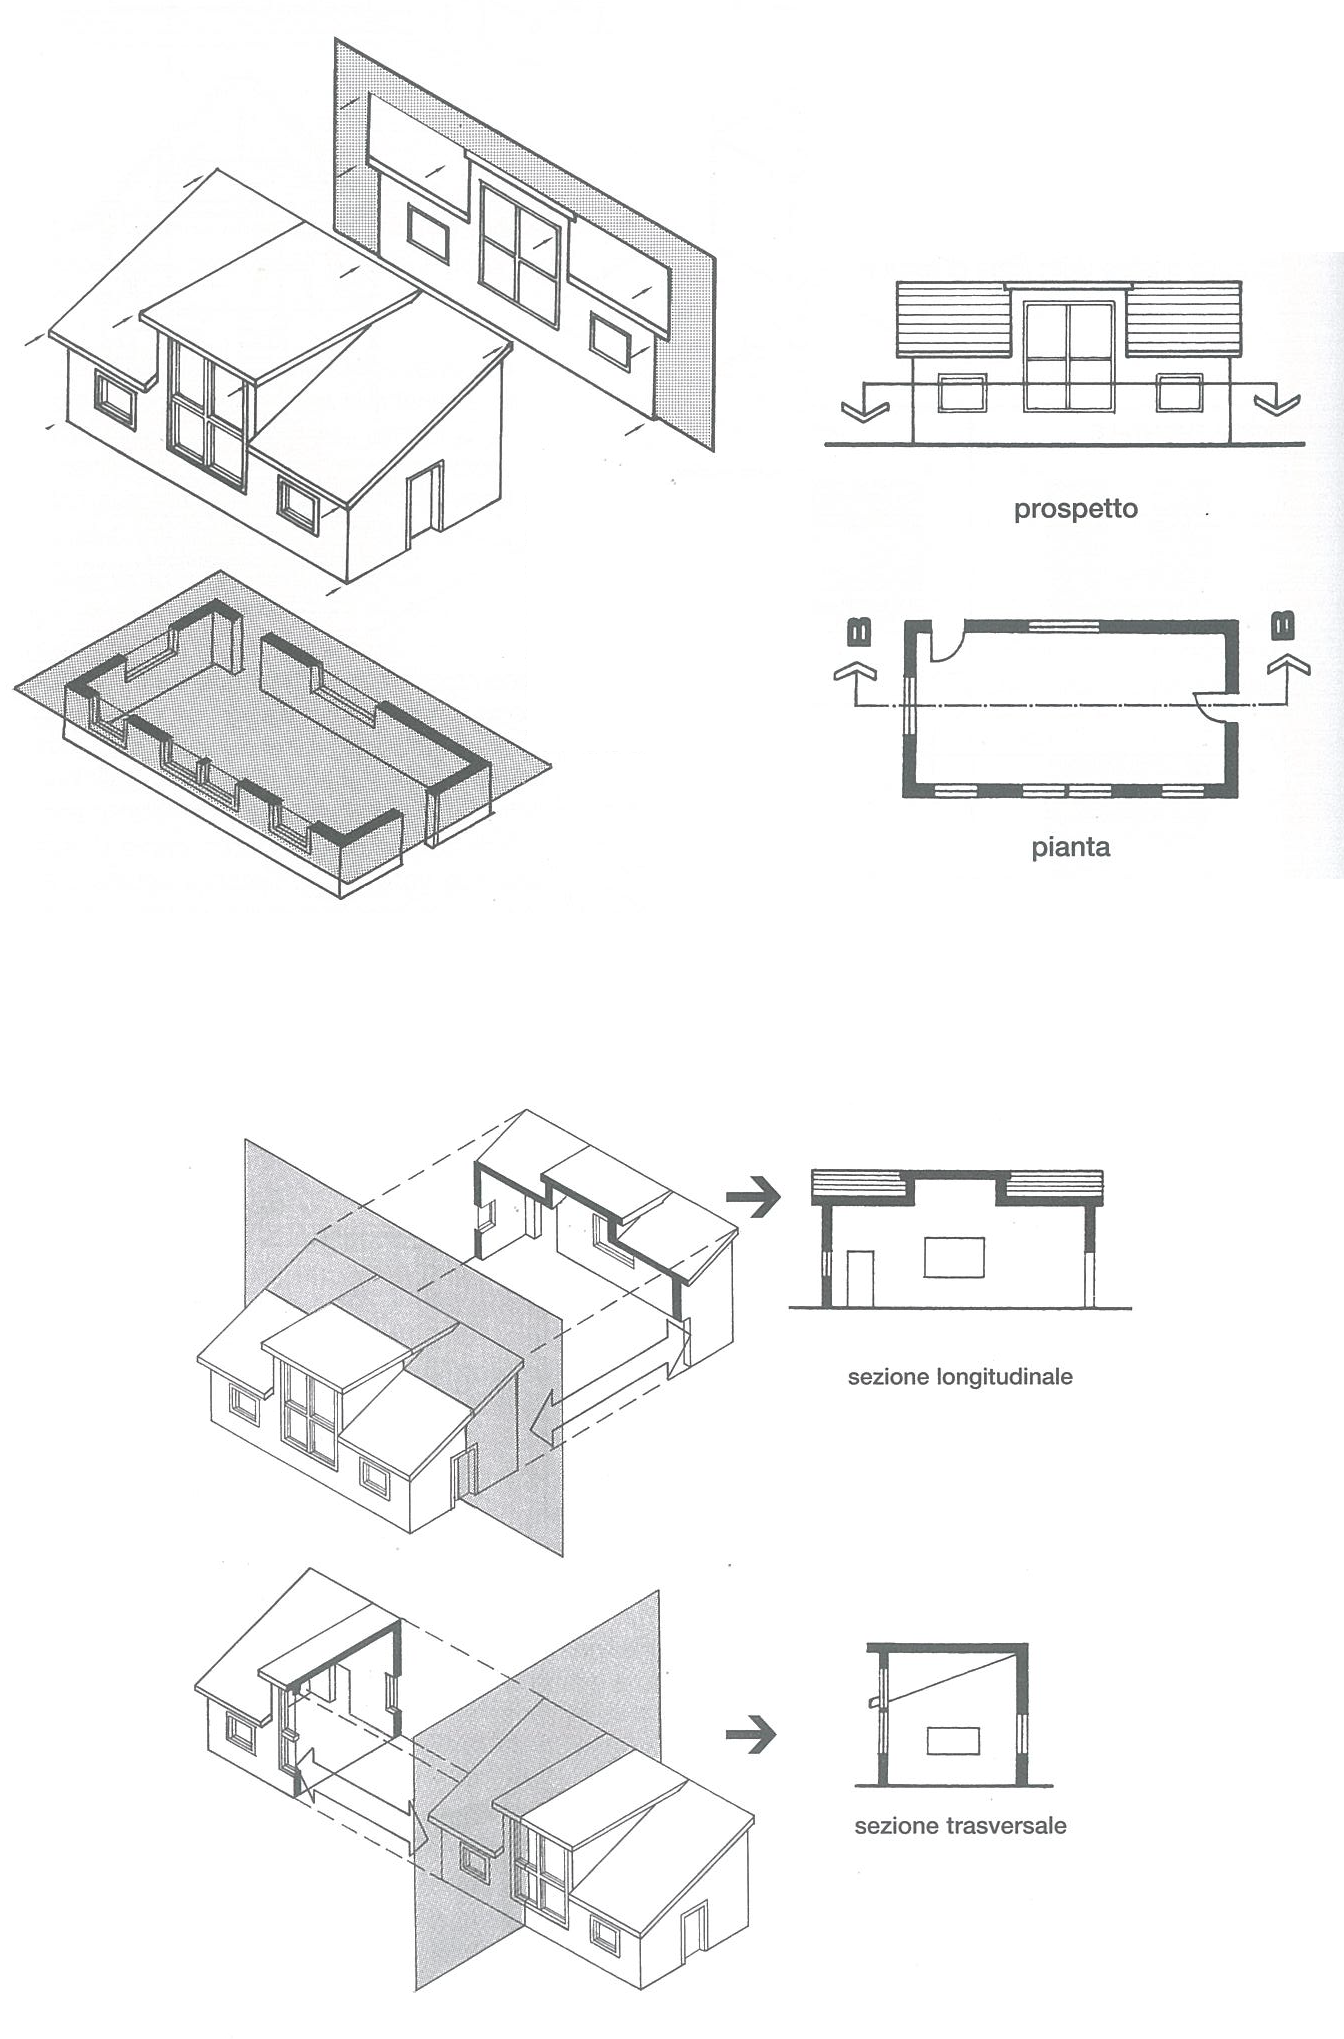
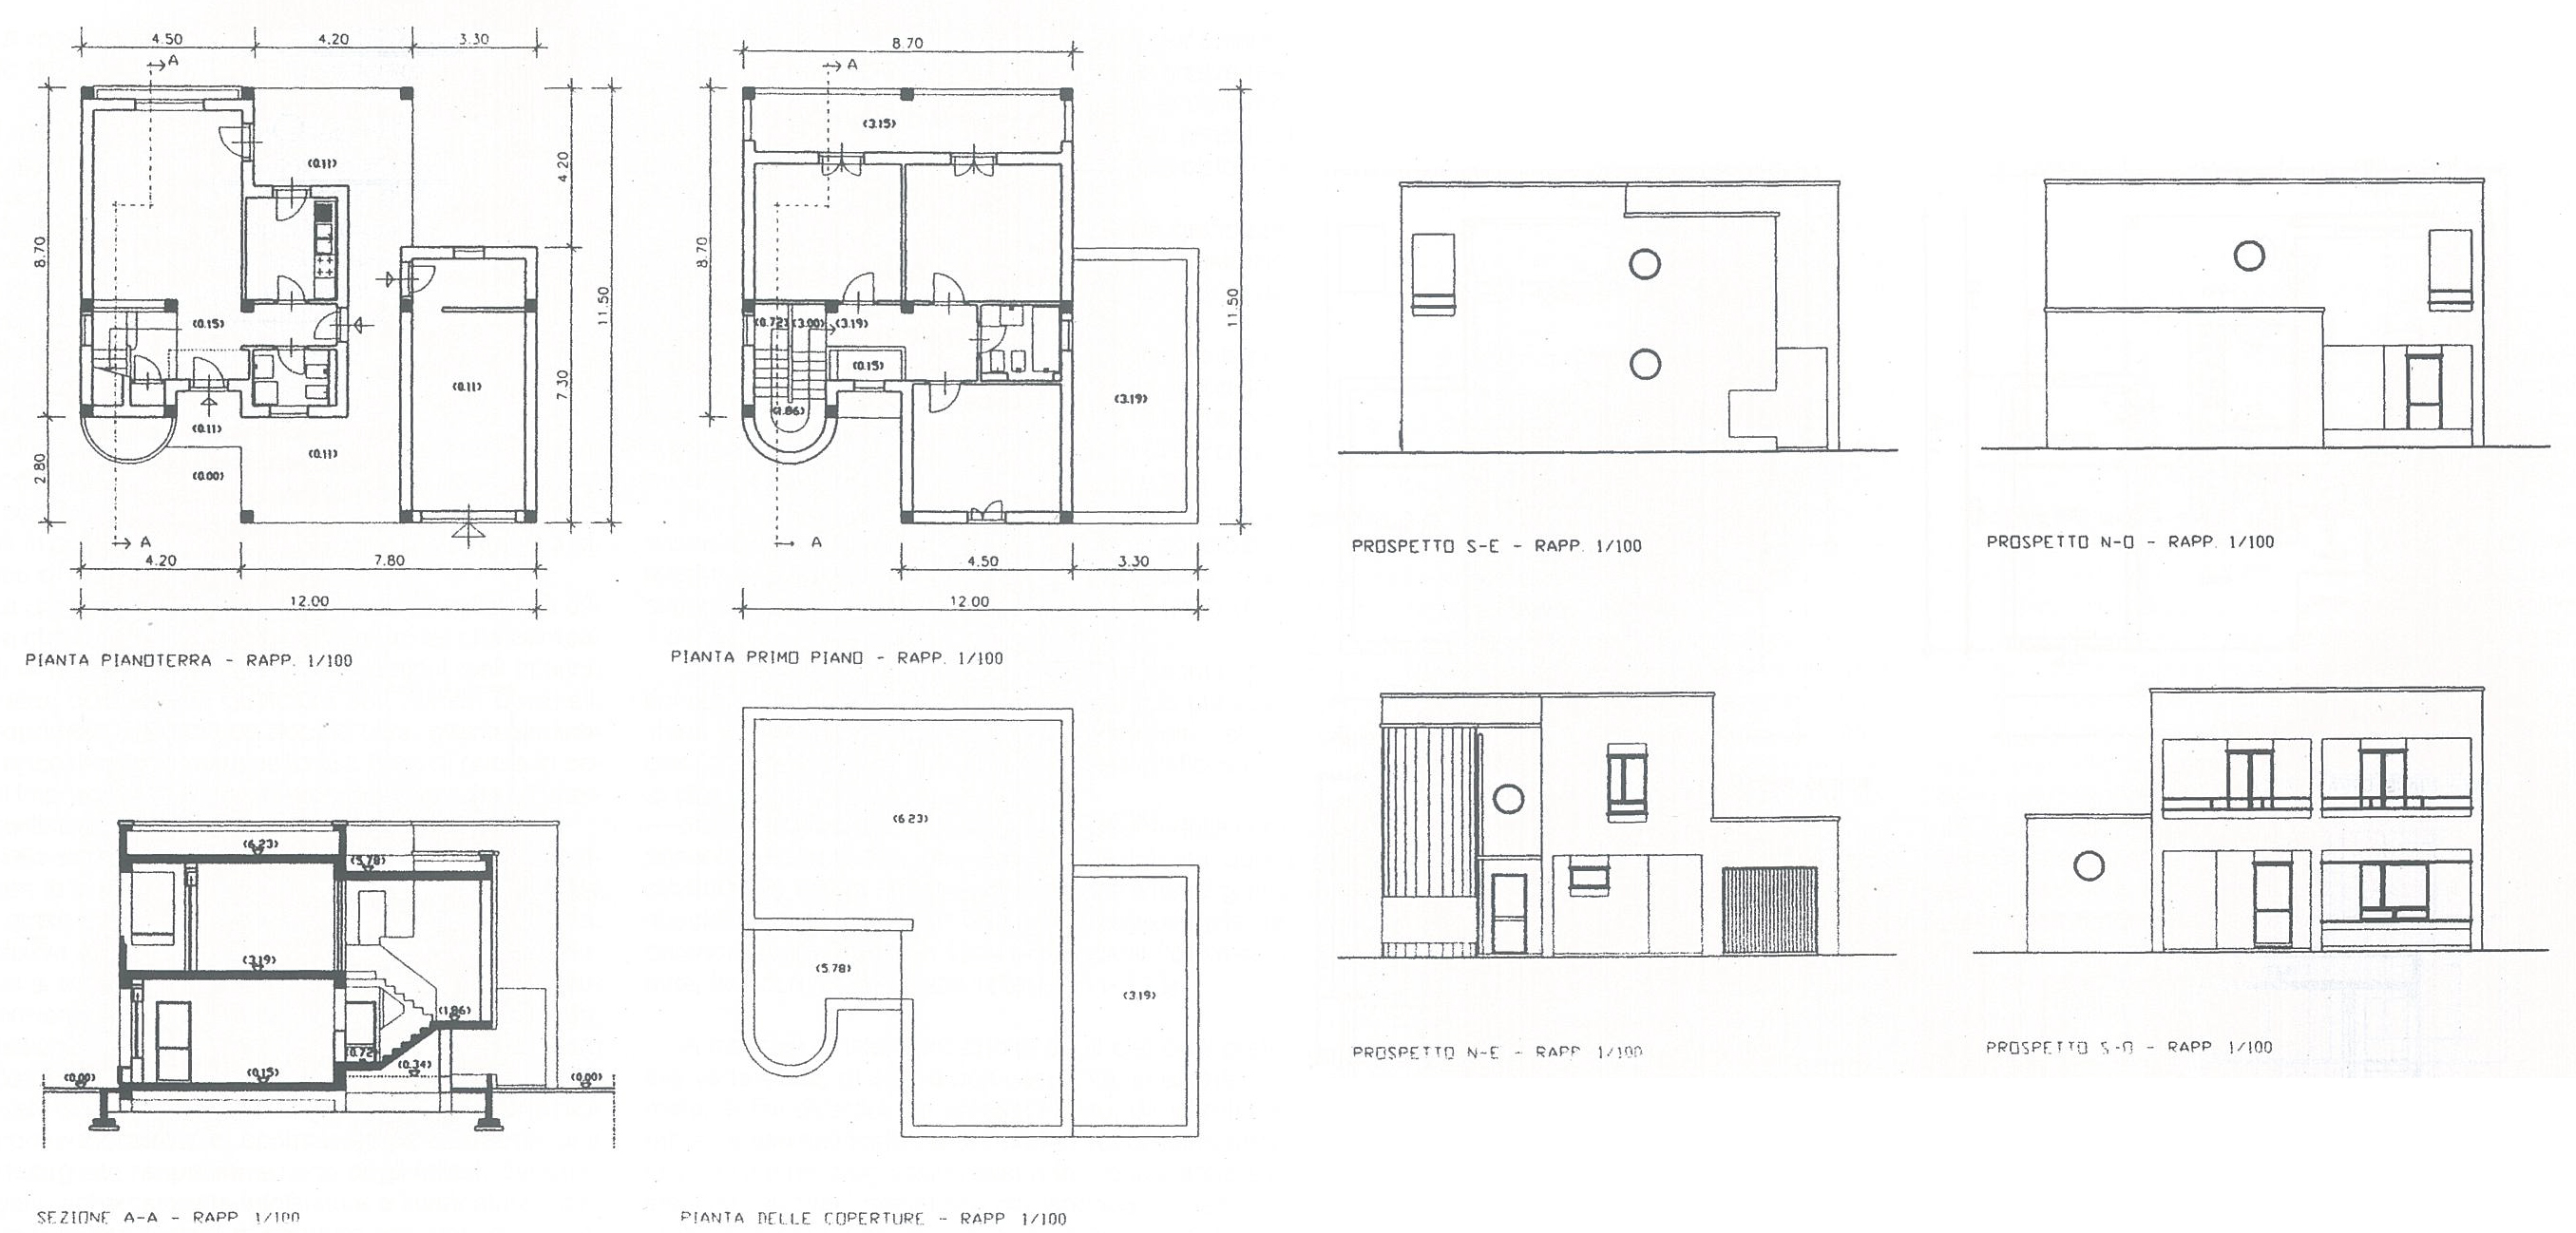
To completely describe the position of something (shape) in 3D space requires at least 2 coupled ones (double orthogonal or Monge projection): from this need comes the typical set of technical drawings useful for representing an architectural object that, as a coherent whole, succeed in describing the three-dimensional complexity: plans/prospects/sections.
The section is obtained by “cutting away” a part of the object via a plane, typically horizontal (for plans) or vertical. Several planes can also be used for the same vertical section, but they should be chosen strictly parallel to each other. For horizontal sections (floor plans) you place the plane at a height of just over 1 meter from the ground plane attempting to intercept the highest quality of architectural information (windows, elevation jumps, structures. etc...).
For vertical sections it is REQUIRED to indicate in all plans the position of the section plane and to direction (with any symbol) of the view.
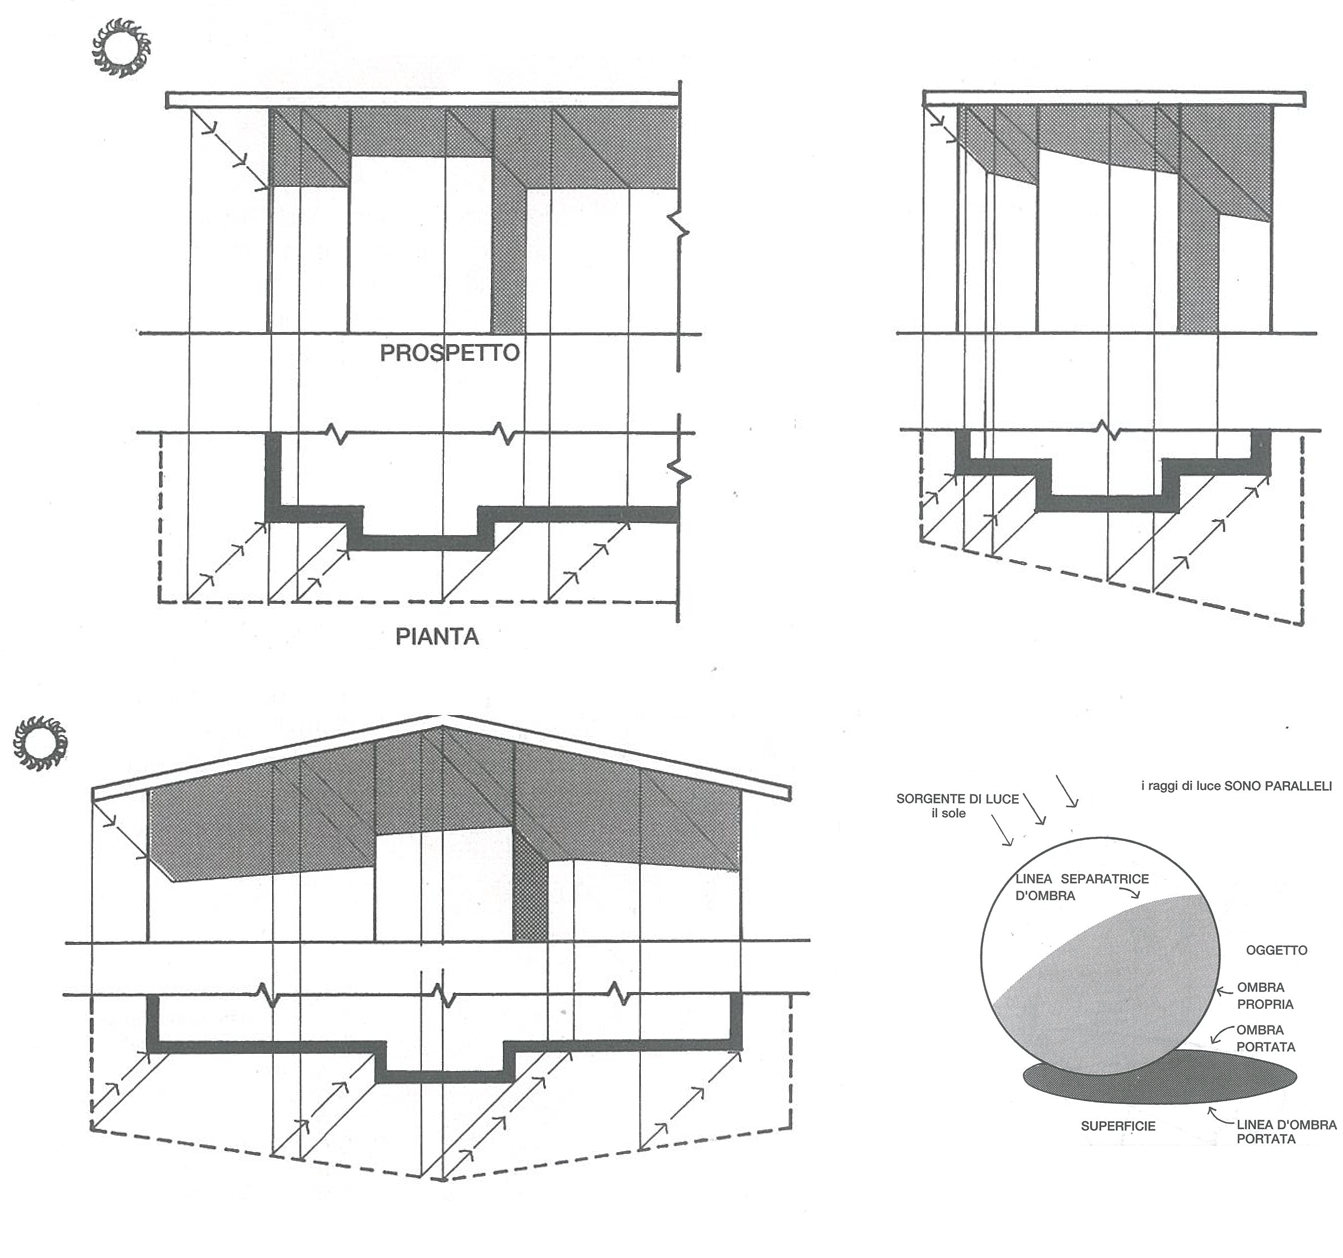
Shadows are disitnguished into Proper (the parts of an object that are in shadow because they are obscured by themselves) and Carried (the shadows that one object “carries” over another, hiding it from the light).
Carried shadows, in the case of a photorealistic perspective rendering are used to interpret the depth of the scene and depend directly on the set of light sources arranged in the scene to achieve the best overall illumination.
Technical shadows, on the other hand, are created geometrically by considering a parallel light (a point of light at a theoretically infinite distance) incident at 45° coming from the upper left. With these settings, shadows represent a metric for evaluating overhangs because the size of the projected shadow corresponds to the actual size of the overhang.
In the drawing environment the published norms/standards relate exclusively to product documentation (UNI / ISO > Technical products). In the architecture environment there are often very different needs and issues, so some useful guidance from these standards supplemented by work customs is used.
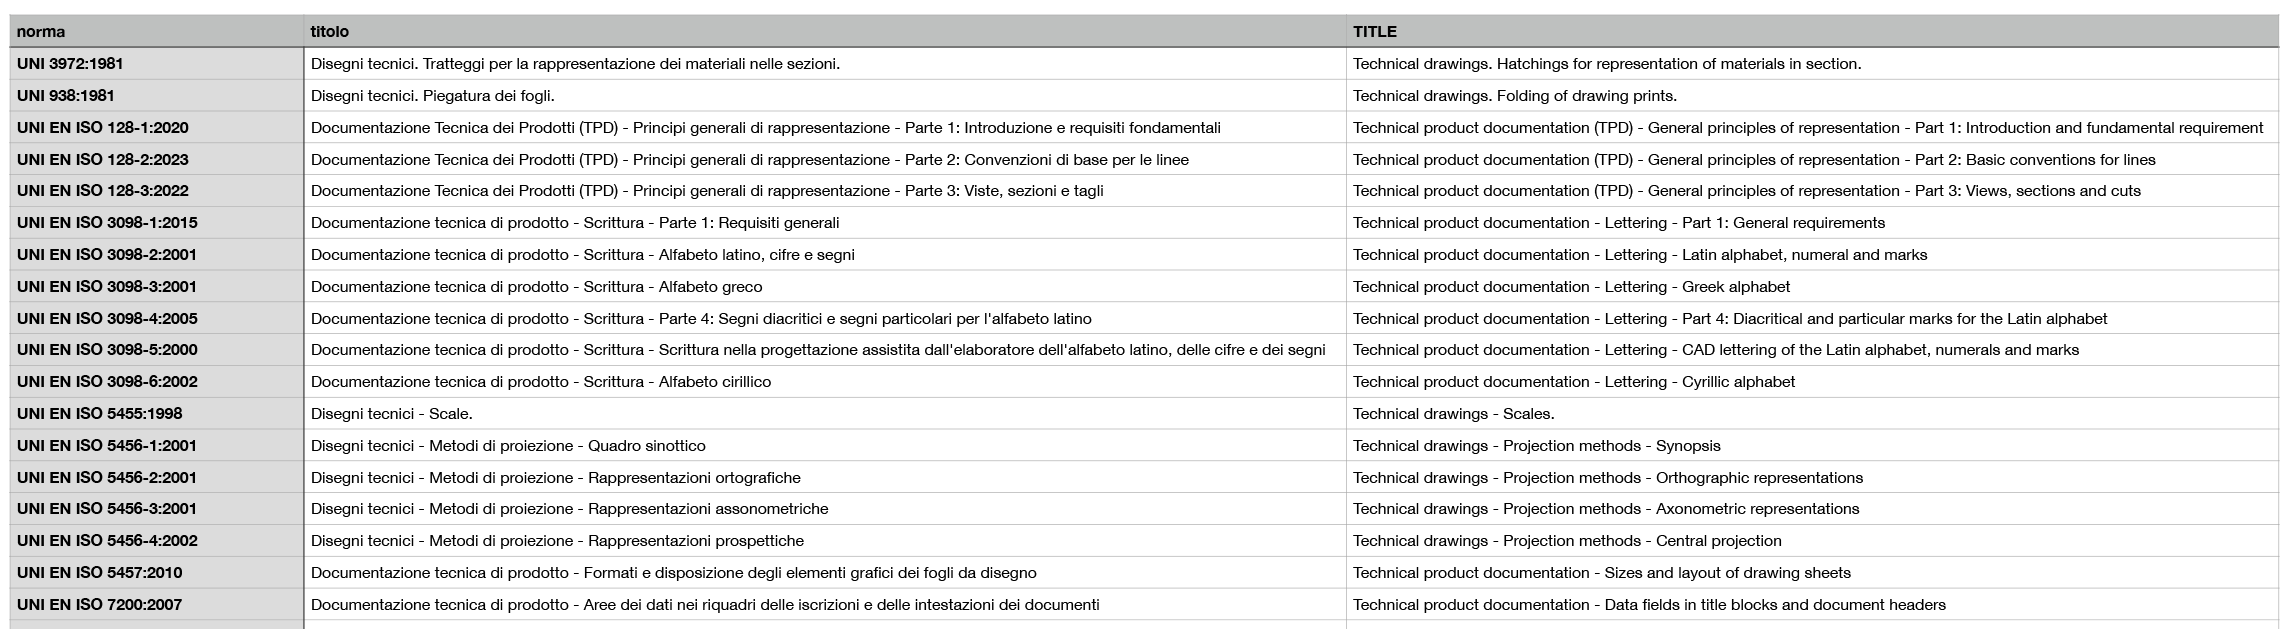
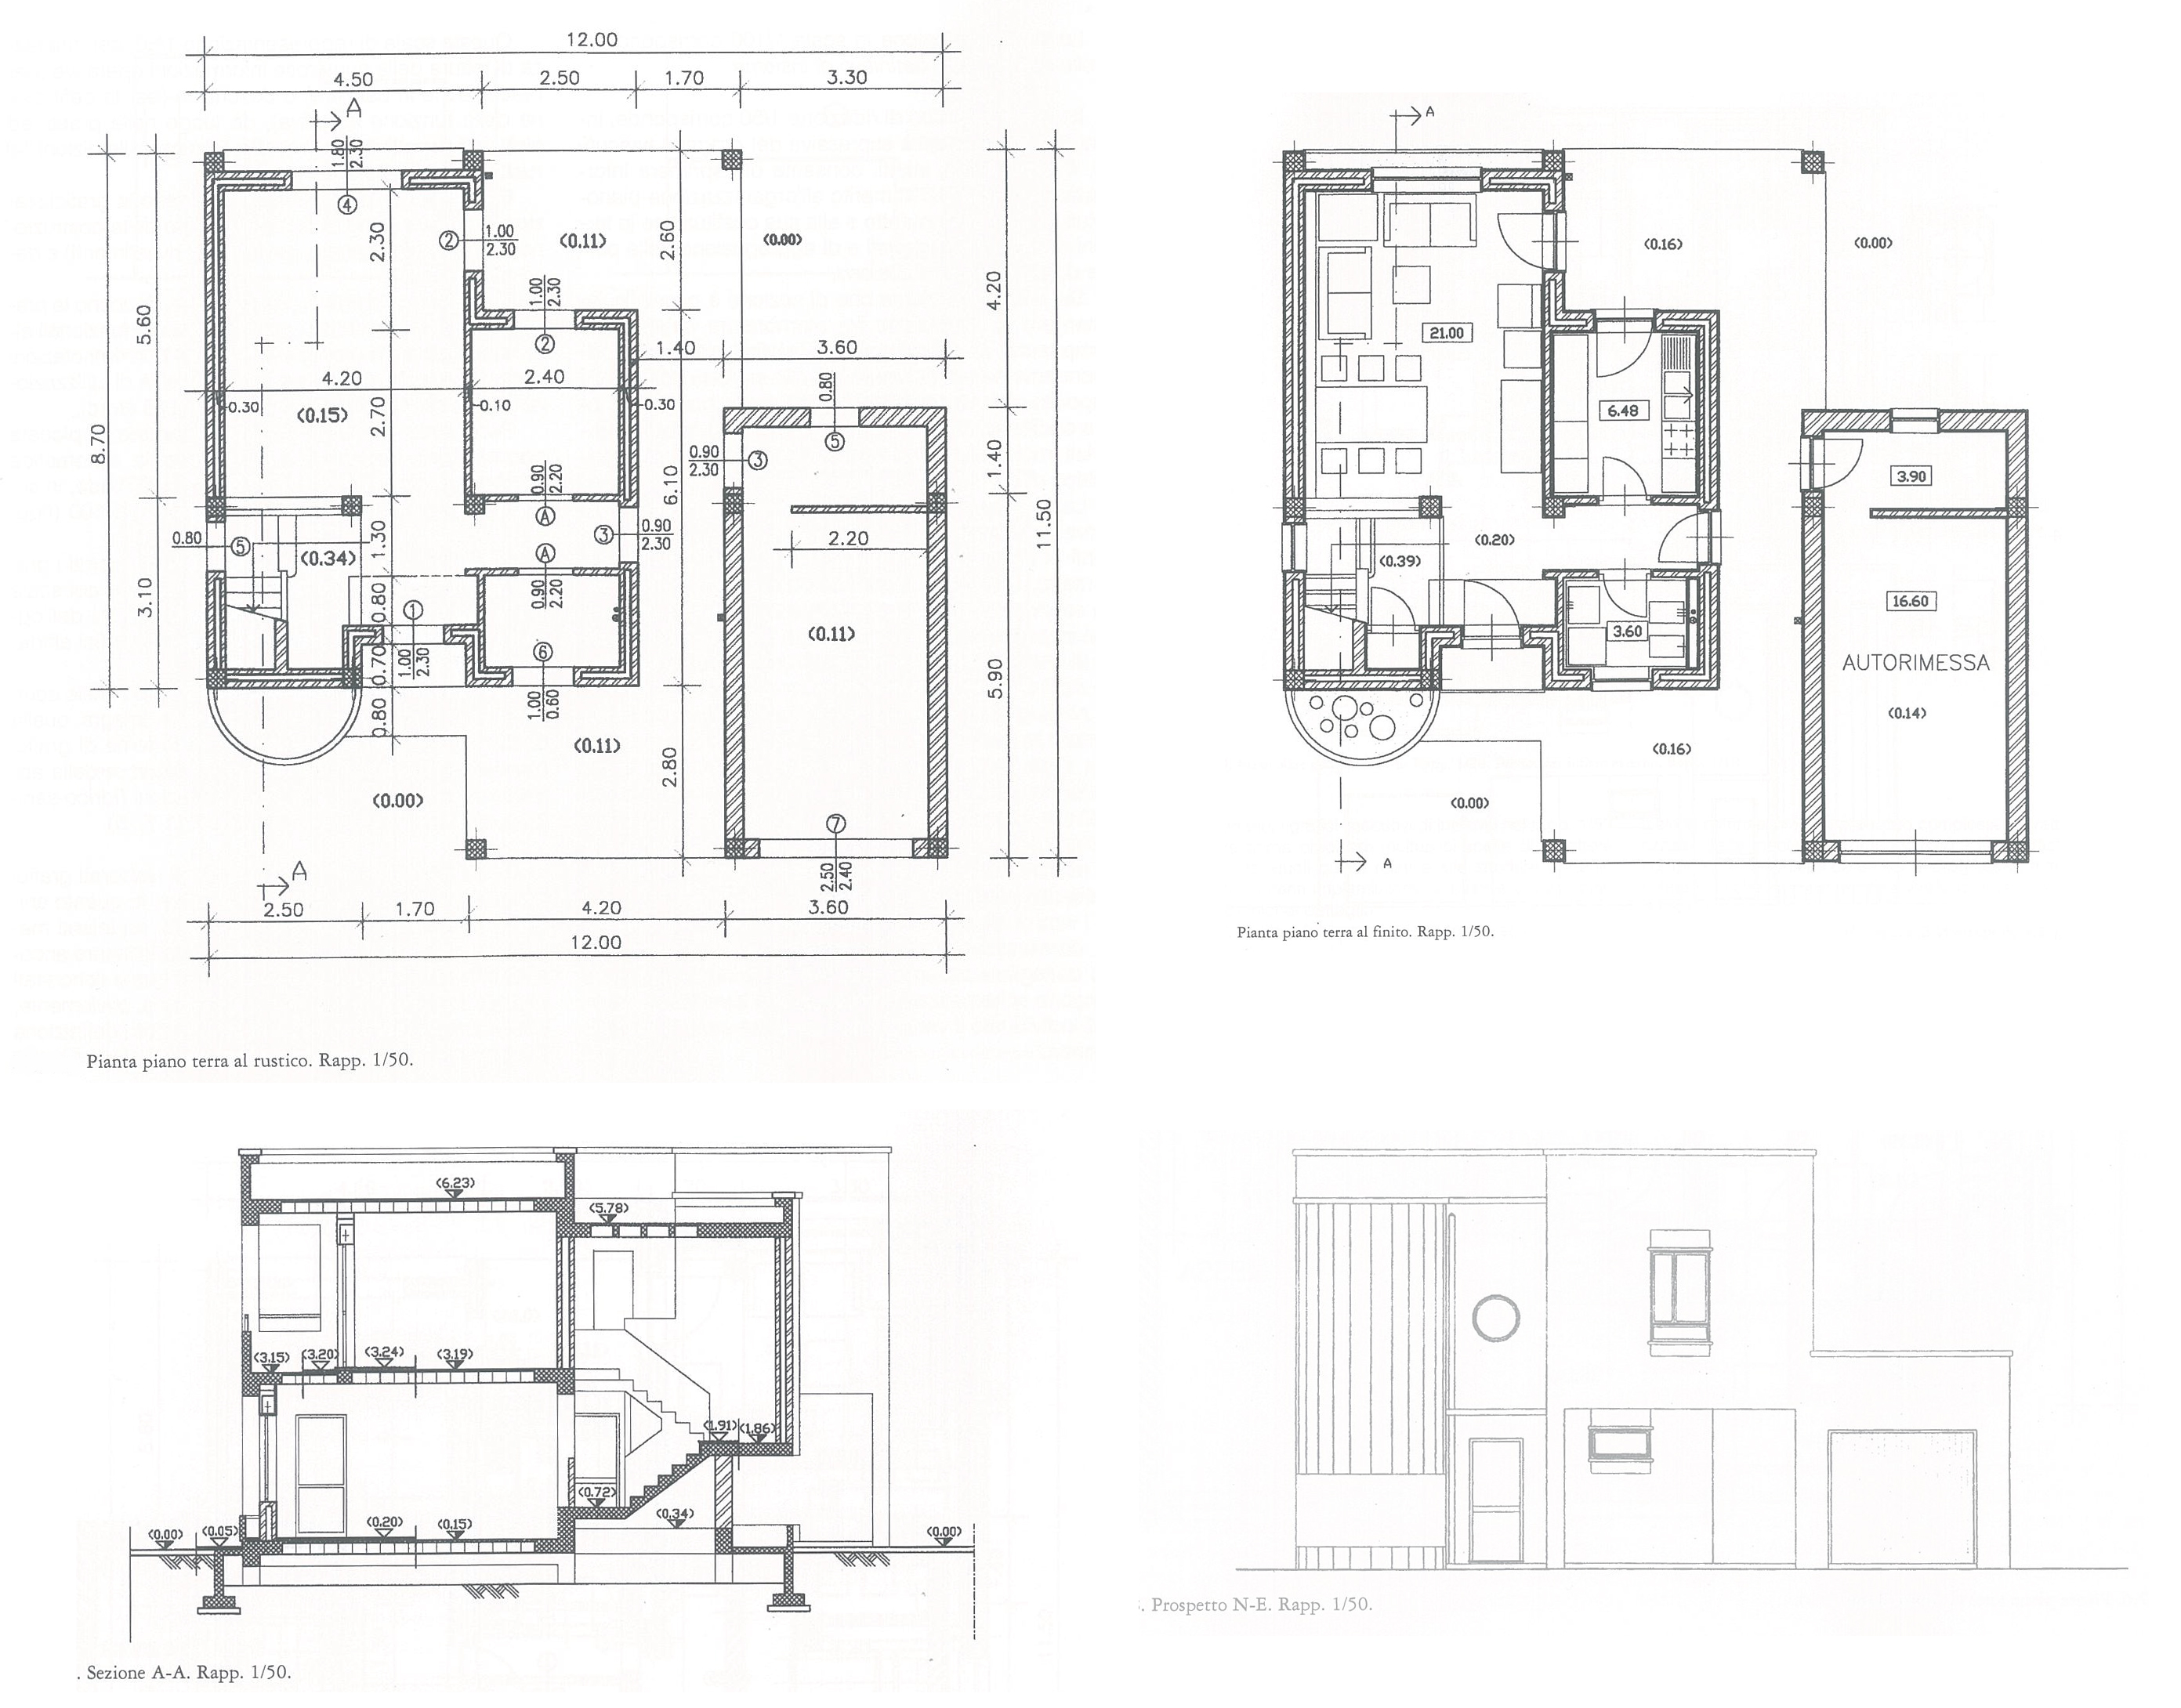
The actual object can be represented in its actual size, reduced or enlarged. The scale of representation is not only a metric aspect but also indicates the stage of development of the information process and the level of depth to be expected in the drawing.
The drawing scale indicates the relationship between the unit in the drawing (the first number) and the same unit in reality (the second number). A drawing scale of 1:100, for example, means that 1 cm in the drawing corresponds to 100 cm in reality. To facilitate direct scaling operations in the easiest way without complex calculations, scale factors on the basis of 1, 2 or 5 are typically used so that it is sufficient to multiply or divide by decimal factors or halve/double the measurements.

The scale of representation implies, in the analog world of the physical paper table, a graphic limit of representation. By imagining a drawing scale and printed line thickness, one can define the minimum size of an object whose edges can be represented while keeping them distinguishable, for example:
line thickness 0.1 mm > scale 1:100 > 4 cm object size
line thickness 0.2 mm > scale 1:200 > 6 cm object size
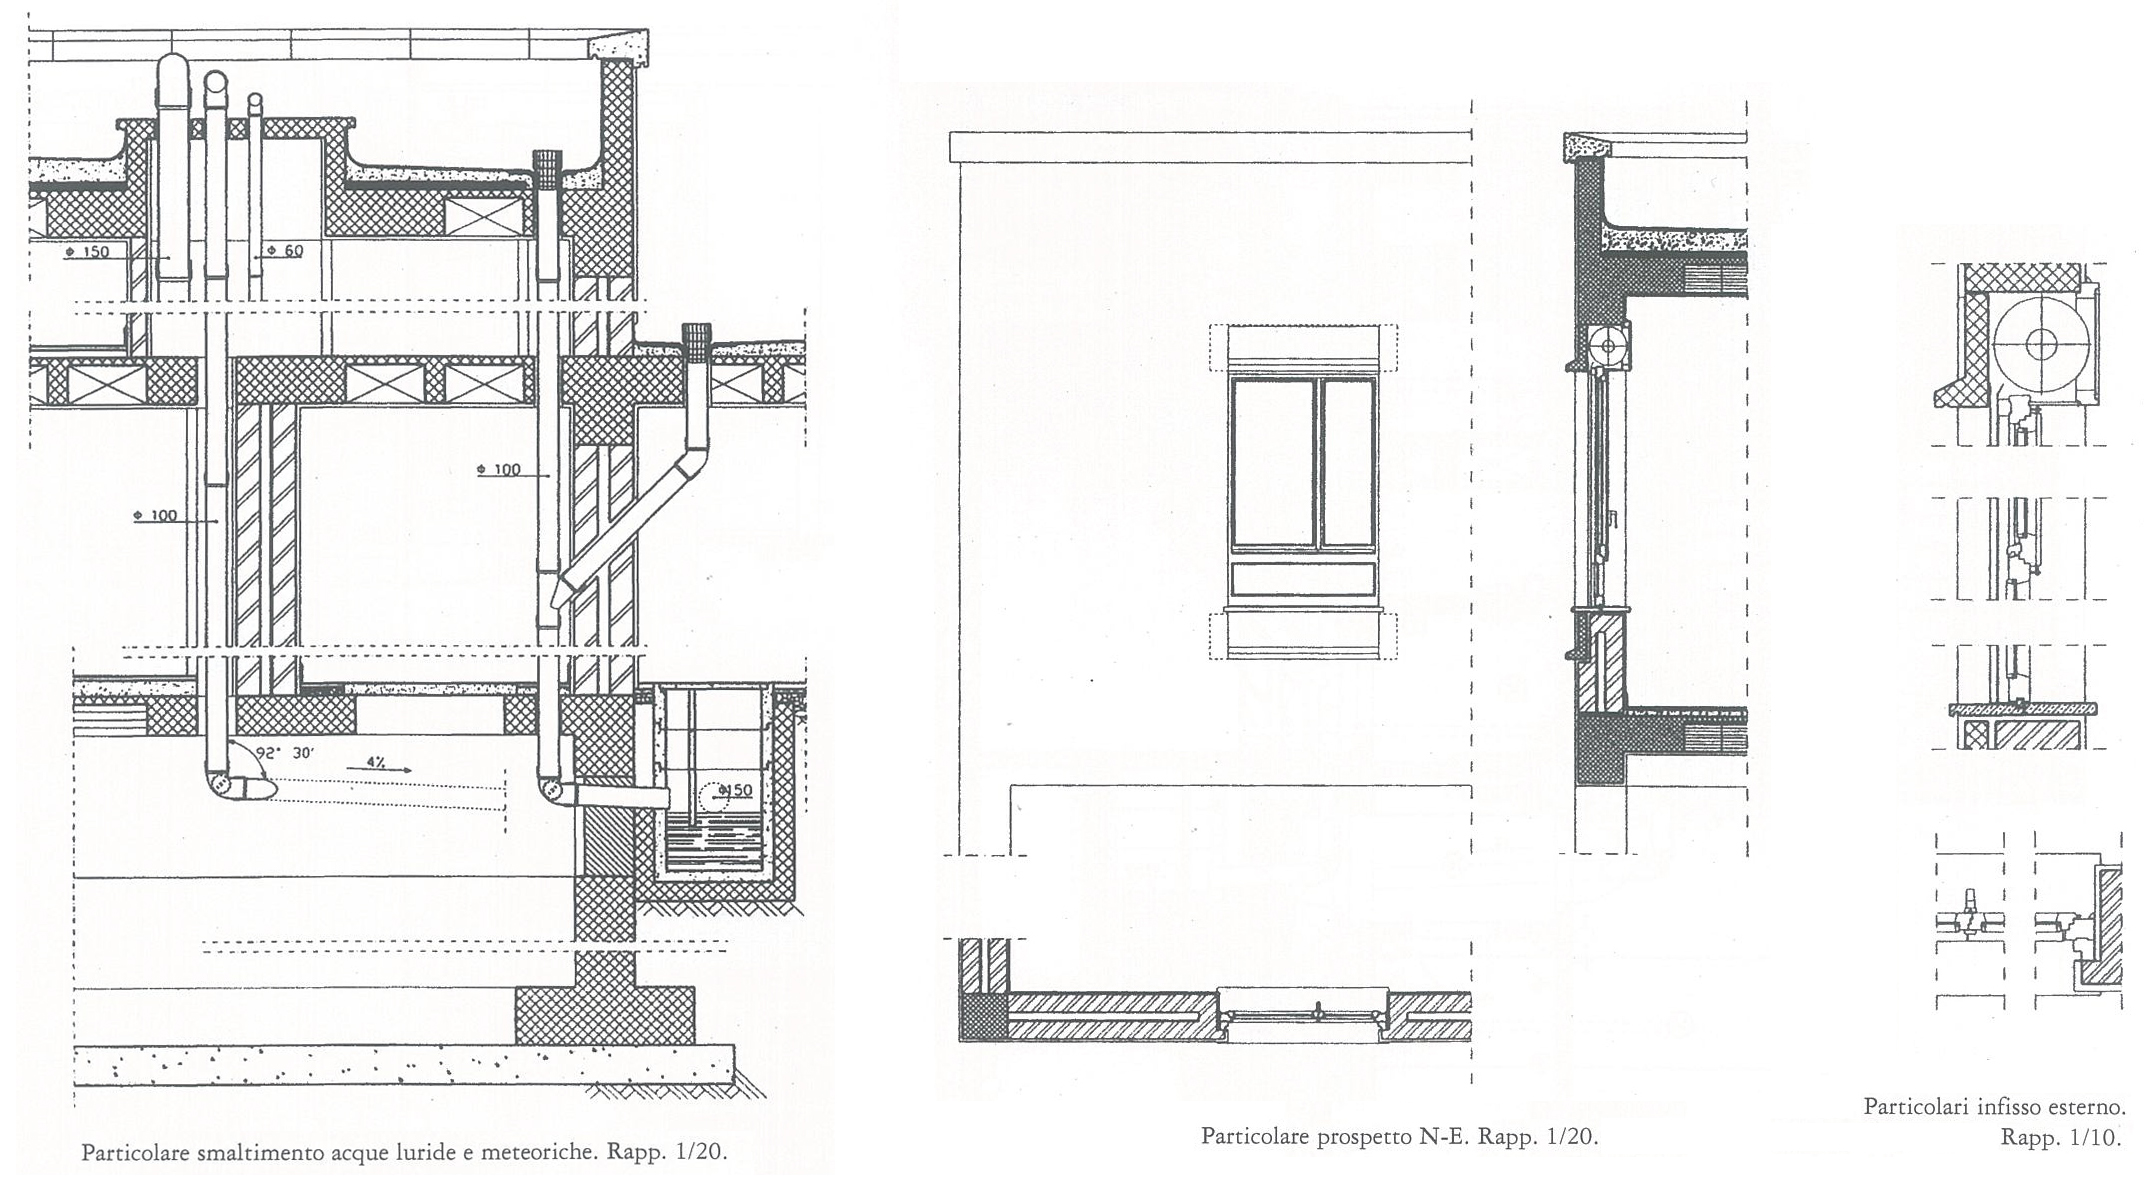
Although this limitation has been overcome by the use of digital software in which the details of an object can be “zoomed in” virtually indefinitely, there remains the traditional approach of identifying the level of detail of a table based on the scale adopted/required according to the phase/finality of the drawing, although there are no standardized rules and reference is made to an established empirical custom.
A scale bar is often added to the drawing so as to ensure an object of known size in the drawing, which is useful for deriving or verifying the scale of representation adopted.

The main elements of drawing are lines and backgrounds. The main characteristics of the strokes are: color thickness and type. Thickness is important if you can easily distinguish one type from another, so it is a good rule to identify only 3 thicknesses in a drawing, each double (or half) the other. Line types are mainly continuous, dashed, dotted, and dot-line.
Standardized types of patterns are derived from product documentation standards. In the context of architectural drawing, the patterns of spans are primarily descriptive.

Each discipline requires a certain “style” of information conveyed in its drawings. They can be distinguished mainly: architectural, structural, mechanical, plant.